How to Enable Crash Debugging, View or Share Memory.dmp or Minidump file in Windows OS
Welcome Dear Visitors All;
If you are a windows user, then you may encounter a blue screen of death error message that indicates that “Your Device Ran into a Problem and Needs to Restart”. This blue screen indicates that your windows detected a system or hardware corruption, so the computer restarted as an attempt to protect your hardware or system files from further corruption. In such case, the computer will write a log report into a file called Memory.dmp or minidump file to inform you what is the problem that caused the system to crash or to restart. But the Crash debugging mode should be enabled before this event.
This topic I will show you how to enable Windows crash Memory dump, and how to view or share the file in windows 10 and windows 11 operating systems to get an online support from Microsoft or from ValiumMedia Techs channel on YouTube.
You can configure your system to write a debugging information either into a large file called Memory.dmp stored in windows folder on this path “C:\Windows\Memory.dmp“, or as a small numerically named file with .dmp extension stored inside Minidump folder on this path “C:\Windows\Minidump\“.
How to Check Crash Debugging Status?
You can check whether the crash debugging status is enabled or disabled by using either Command Prompt or using Advanced System Properties, a System Settings panel. Both methods are applicable to Windows 7,Windows 8, Windows 10, Windows 11 or any windows edition.
How to Check Debugging Status from Advanced System Settings?
- Press Windows + R keys from keyboard to open Run tool
- Type SystemPropertiesAdvanced and press Enter to open System Properties settings panel.
- Click on Settings icon under Startup and Recovery field
- If None is the selected option under Write Debugging Information field, then the debugging status is disabled in your computer.
- So select Automatic Memory Dump or Small memory dump or another option to enable the Memory Dump debugging.
- In Advanced Recovery Environment, you can use CMD to open System Properties Advanced after changing the CMD path into System32 folder.
How to Check Debugging Status Using CMD in Windows 11?
- To check debugging status from Command Prompt, do the followings:
- Type CMD into search box and then run the Command Prompt as administrator
- Type the following command and press Enter
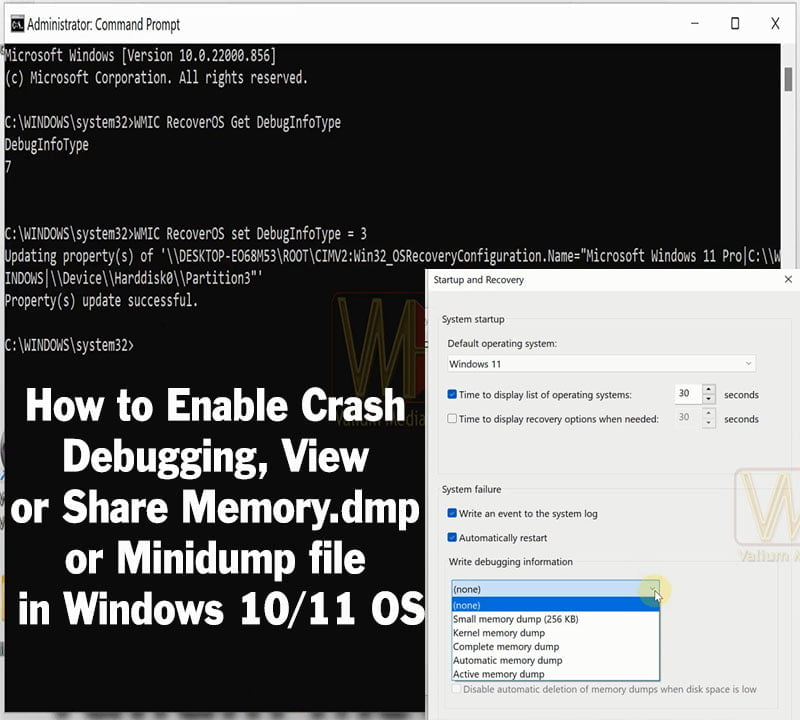
- WMIC RECOVEROS Get DebugInfoType
- The seven value indicates that the Debugging is enabled in Automatic Memory Dump mode.
- Note: In Advanced Recovery Environment, you have to change the CMD path into C:\Windows\System32 folder first, in order to check or to enable Crash debugging mode using this command:
- CD /D C:\Windows\System32
- Replace the C with the letter of windows drive in your PC.
- CD /D C:\Windows\System32
How to Enable Crash Dump Debugging in Windows 10 AND Windows 11?
You can enable the Crash debugging mode in windows using one of the following methods:
- From System Properties settings
- From Command Prompt
- From Registry Editor
How to Enable Crash Debugging Using System Properties settings:
- Press Windows + R keys from keyboard to open Run tool
- Type SystemPropertiesAdvanced and press Enter from keyboard to open System Properties settings
- Click on Settings icon under Startup and Recovery field
- From Write Debugging Information field, choose Complete Memory Dump, Kernel Memory Dump, Automatic Memory Dump, or Small Memory Dump according to what you want
- After that, click Ok to save changes.
How to Enable Crash debugging Memory File Using CMD?
- To enable Memory dmp or minidump creation using CMD, do the followings:
- Type CMD into Search box and then Run the Command Prompt as administrator
- Execute the following command to enable Complete Memory Dump:
- WMIC RECOVEROS set DebugInfoType = 1
- Execute the following command to enable Kernel Memory Dump:
- WMIC RECOVEROS set DebugInfoType = 2
- Execute the following command to enable Small memory dump (128 KB):
- Execute the following command to enable Automatic memory Dump:
- WMIC RECOVEROS set DebugInfoType = 7
- To disable Crash debugging, execute this command:
- WMIC RECOVEROS set DebugInfoType = 0
- You can also use the same commands to enable the debugging memory files from Windows Recovery Environment, but you have to change the CMD path to System32 folder first using this command:
- CD /D C:\Windows\System32
- Replace the C with the letter of windows drive in your PC.
- CD /D C:\Windows\System32
How to Enable Debugging Memory File Using Registry Editor?
- To enable crash debugging file from registry editor, do the followings
- Press Windows logo + R keys to open Run Tool
- Type Regedit and press Enter to open Registry Editor tool
- Navigate to this key path:
- Computer\HKEY_LOCAL_MACHINE\SYSTEM\CurrentControlSet\Control\CrashControl
- Right click on CrashDumpEnabled key and then select Modify option
- Change the value data into one of the followings:
- Type 1 to enable Complete Memory Dump
- Type 2 to enable Kernel memory Dump
- Type 3 to enable Small Memory Dump
- Type 7 to enable Automatic Memory Dump
- You can enable debugging from advanced recovery menu using Registry editor as followings:
- Type REGEDIT into command prompt and press Enter to open Registry editor
- Select HKEY LOCAL MACINE
- From File tab, select Load Hive option
- Select your windows and then navigate to Windows\System32\Config folder
- Select System file and then click on Open option
- Type Sys and then click ok to load the system Registry file
- Expand Sys key and then navigate to this path:
- ControlSet\Control\CrashControl
- Right click on CrashDumpEnabled key and select Modify option
- Type three to enable Small Memory Dump, or type Seven to enable Automatic Memory Dump
- Collapse the keys list and then select Sys key
- Click on file tab and then select Unload Hive option
How to Read Memory Dump File?
- To View the memory.dmp or the Minidump file, do the followings:
- Install the WinDbg tool from Microsoft Store or from the official Microsoft website for free
- After installing the debugger tool, locate the tool launcher and start it
- From File tab, select Open Crash Dump option
- Navigate to the windows or Minidump folder and then double click the dump file to load it.
- Click on !analyze -v to start analyzing the crash file
- Note: You have to be connected to the internet in order to download the debugging codes and symbols required to analyze the file.
- You have to have enough experience in coding and in Microsoft symbolsmeanings in order to understand the analyzing result of the Memory.dmp file.
- You can also use free windows memory.dmp viewer from third party source, such as NirSoft BlueScreenView tool. This free tool can also be used while booting into Windows Recovery Environment.
How to Share the Memory Dump File?
- To get an online support, you can upload the memory dump or minidump file as followings:
- Open C:\Windows\ and/or C:\Windows\Minidump\ folder according to debug settings in your computer
- Copy the memory.dmp file or the Minidump file into Documents or another folder so you can compress and share the file without access denied or permission errors, because windows security settings is not allow copy or modification the files in their default paths.
- Right click the Memory.dmp file and then select “Compress to zip File” option to reduce the file size so you can share it faster.
- You can copy both memory.dmp and minidump files if your computer created both files.
- If you have failed to copy the files, you can run the CMD as administrator and then execute one of the following commands to copy the files into Dump folder in the main directory of C partition:
- XCOPY /R /H /i “C:\Windows\Memory.dmp” C:\DUMP
- To copy Memory.dmp file
- XCOPY /R /H /i “C:\Windows\Minidump” C:\DUMP
- To copy Minidump folder or its contents
- XCOPY /R /H /i “C:\Windows\Memory.dmp” C:\DUMP
- To compress the Dump folder using CMD, execute this command;
- Powershell Compress-Archive c:\dump c:\dump.zip
- In Advanced Recovery Menu, you can send the Memory.dmp file into a USB drive, after that, connect the USB drive to your mobile or another computer to upload the file into google drive or into another file hosting website or online cloud.
- After that, copy the link and add it in a comment or into email to get the online help.
How do I upload files to a shared Google Drive?
- To upload the file into your Google Drive, do the followings:
- Click on +New icon in the upper left corner and then select File upload option
- Navigate to the file path and double click it to start uploading
- You can also drag and drop the zip file into the main website page to upload it.
- To all others viewing or downloading the file, hover on the file name and then click on the Share icon, and then change the General Access of the file from “Restricted” to “Anyone with the link” option and click Done to save changes. After that, copy the link and share it to anyone you want to share with.
VIDEO:
For more details about how to enable crash debugging mode, and how to view or share the memory.dmp file to get online support, watch the following video to see everything step by step: